About Lucid Analytics
Lucid Analytics thrives on precision and delivers real-time, predictive marketing insights so you can make informed decisions before issues arise.
Marketing thrives on precision, but most analytics tools operate in hindsight. I built this platform to change that—delivering real-time, predictive insights so marketers can make informed decisions before issues arise.
This isn’t just another tool that aggregates data into a dashboard. It’s the result of months of testing, training, and refining machine learning models on real-world marketing data. Our goal is to create a system that understands the complexities of customer behavior, media performance, and brand sentiment—and predicts outcomes with accuracy.
How I Built It
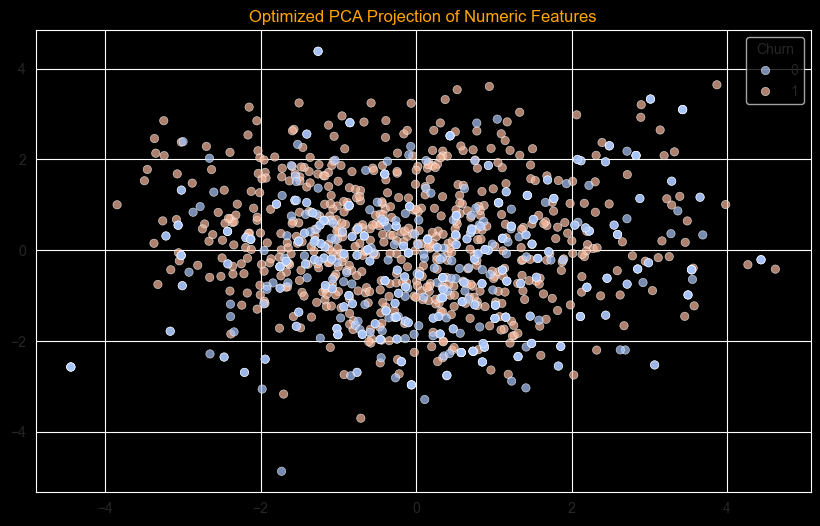
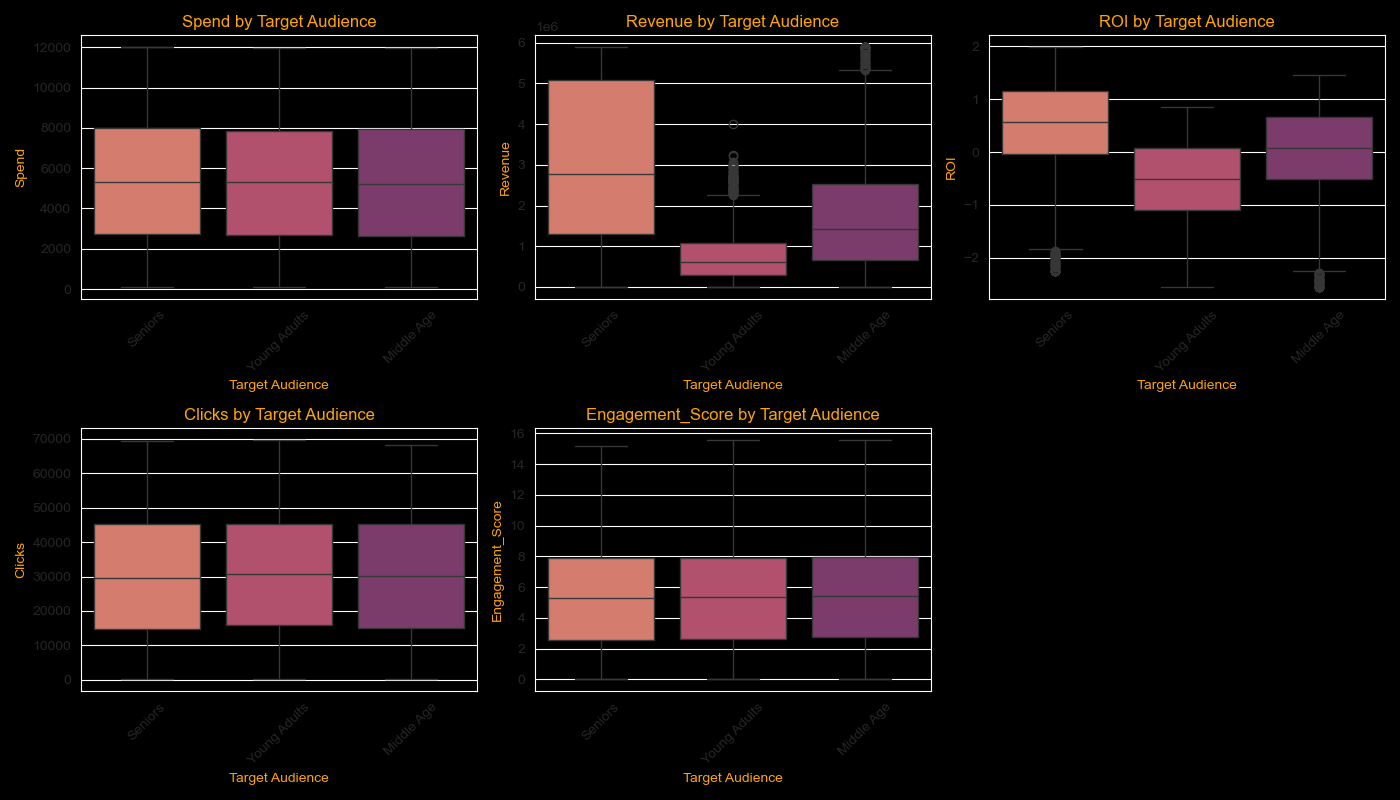
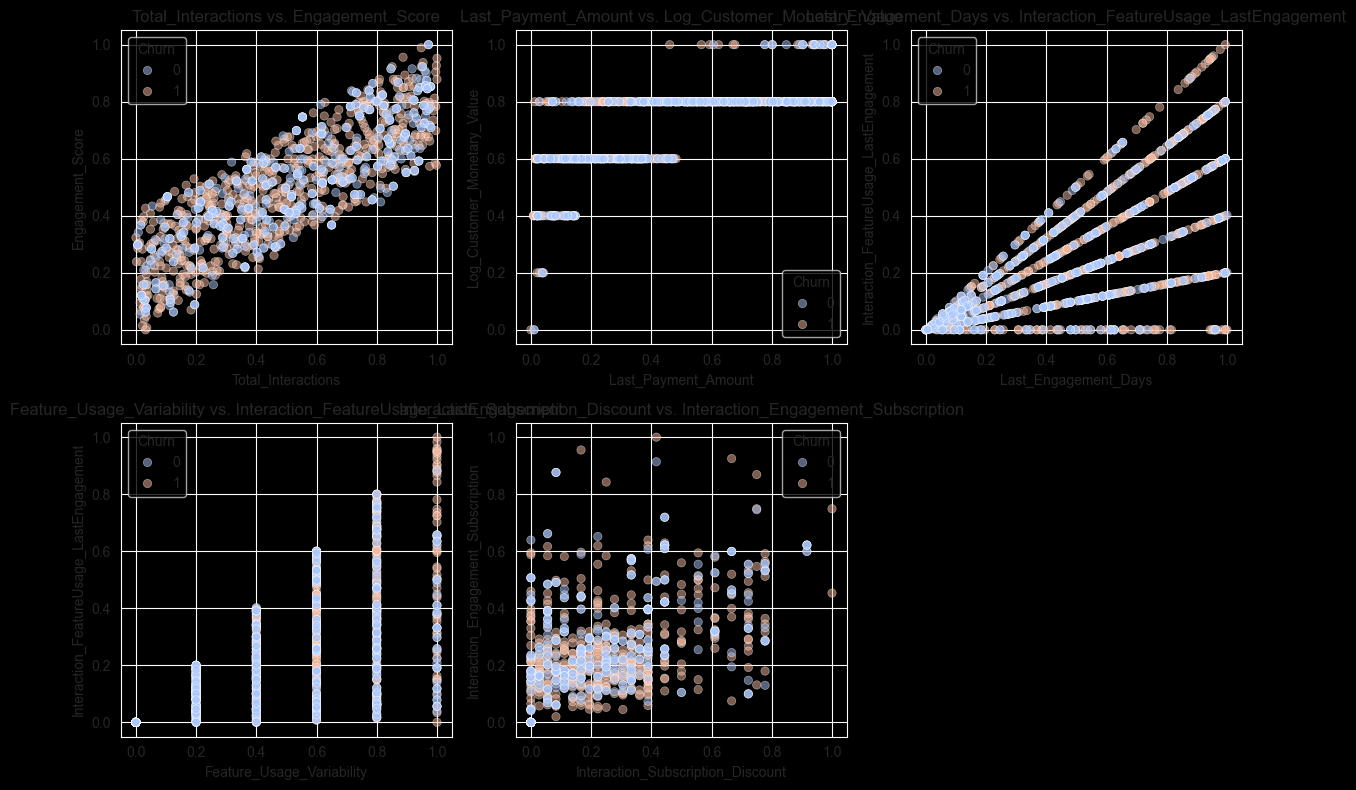
I started with real marketing datasets from platforms like Kaggle—datasets filled with customer behaviors, purchase trends, ad performance metrics, and loyalty indicators. I performed extensive exploratory data analysis to identify patterns, clean inconsistencies, and remove noise. This careful preprocessing ensured our models learned from accurate, meaningful information.
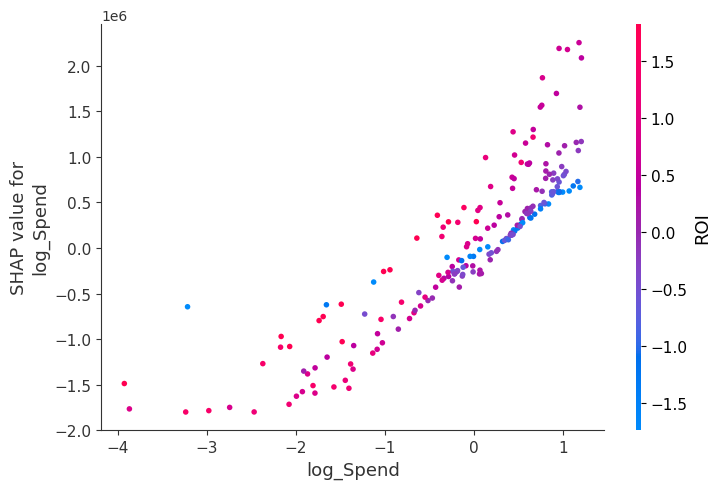
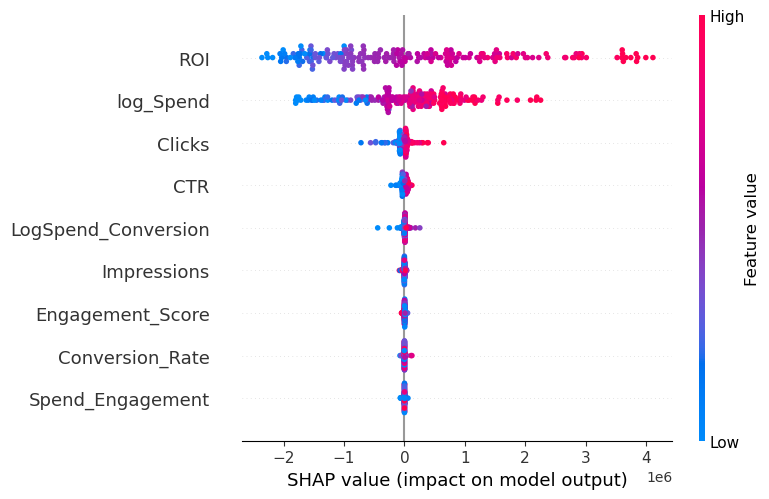
Next, I trained and tested multiple machine learning algorithms, refining them continuously to improve accuracy. For churn prediction, I focused on behavioral trends such as customer engagement, purchase history, and interaction patterns. For NPS scoring, I modeled sentiment shifts using past survey responses and customer touchpoints. For media effectiveness, I evaluated the direct impact of ad spend, identifying which investments truly drive conversions.
Training Graphs

Overcoming Challenges & Continuous Improvement
Building predictive models isn’t simple. I encountered challenges such as overfitting and misinterpreted signals, which required constant troubleshooting and iteration. By fine-tuning our models and refining our input features, I improved accuracy. Once deployed, our system continuously updates with new data, ensuring predictions remain relevant as consumer behavior evolves.
What This Means for Marketers
Our platform empowers marketers to launch smarter campaigns, identify at-risk customers early, and gain deeper insights into their brand’s performance. It’s not just a collection of numbers—it’s a real-time marketing intelligence tool built to drive data-driven decision-making.
Model Performance & Accuracy
Our models have been rigorously tested to deliver reliable predictions. Below are key performance metrics:
Churn Model Performance
Test RMSE: 0.846
This means our churn model predicts with an average error of 0.84 units.
F1 Score: 0.80
A balanced measure of precision and recall.
Media Model Performance
R-Squared: 0.9801
A near-perfect score showing our media spend model explains 98% of the variations in ROI.
MAE: 0.75
This indicates that on average, predictions deviate by 0.75 units.
NPS Model Performance
RMSE: 0.77
Measures prediction errors for NPS classifications, with lower values indicating more accurate sentiment categorization.
F1 Score: 0.70
Combines precision and recall, ensuring reliable classification across the NPS categories (Promoter, Passive, Detractor).